Thank you for visiting Weapons of Mass Injustice!
Sometimes we all need a healthy break from our phones. For the best viewing experience, please visit the site on desktop.

Weapons of
Mass Injustice

Visualizing the unequal impacts of gun violence and the search for peace in America's cities

by Marisa Ruiz Asari

Americans are 25 times more likely to be killed by a gun than residents of countries with similar GDPs. Contrary to media portrayals and policy discussions of the gun violence crisis in the US framed around mass shootings, daily gun violence – shootings that result in the disproportionate killing of young people of color and the loss of life to suicide – make up the majority of gun deaths in the US.

Gun violence and firearm offense data have historically been used to justify the criminalization of Black and Brown youth in America. But what if the gun violence crisis was treated as a public health crisis rather than another cause for mass incarceration? This visual essay explores data on daily gun violence and documents efforts working to promote peace and collective healing.

candles
US - White men, 401 Japan, 48 Canada, 114 Brazil, 325 US, 698 US - Black men all ages, 2,417 US - Black men ages 35-39, 5,435

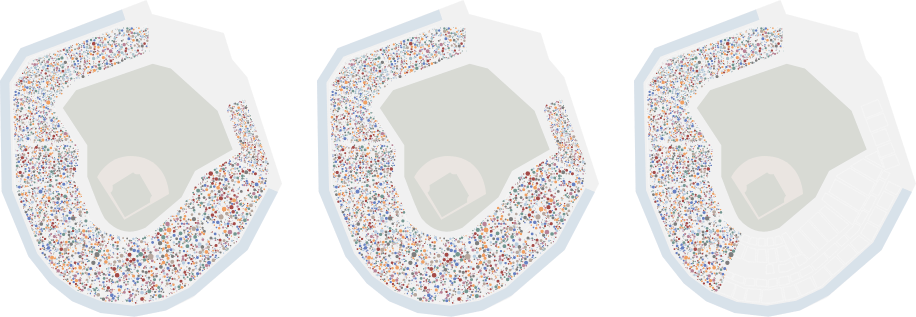
39,201 Americans
were killed by a gun in 2018. 1

That's enough to fill Citi Field baseball stadium in Queens, New York.
62% of gun deaths in 2018 were suicides.
36% were gun homicides.
2% were accidents or were of an undetermined nature.
While these numbers paint a grim picture, percentages and annual gun death counts can only tell us so much about the nature of gun violence in the US.
To fully understand this crisis, we need to look at rates, often measured as the number of gun deaths per 100,000 people.
On average, there were 12 gun deaths for every 100,000 Americans in 2018.1
By breaking down the gun death rate by 10 year age categories, we start to see that gun violence doesn't impact all Americans equally.1

Interact with this graph by toggling the legend items or hovering on data points

The plot of death rates by age has two peaks, one around ages 15-34, and another for ages 75-84.
But these peaks are driven by two very different types of gun deaths. Gun homicides are highly concentrated around young Americans, while gun suicide is more evenly dispersed and highest among older populations.1

Interact with this graph by toggling the legend items or hovering on data points

This graph highlights two very distinct types of gun violence in the US, but it fails to capture even greater inequities in gun violence each year.
The largest inequities in gun deaths become apparent when we look at these rates by race/ethnicity.1
In overlaying these graphs, we can see that the gun homicide rate for young Black Americans is significantly greater than both the gun homicide or gun suicide rate of any other age or racial/ethnic group.1

Interact with this graph by hovering on points

But while gun suicide is considered a public health crisis, gun violence is framed as a crisis of criminality.
Some might ask why addressing gun violence solely through law enforcement and the criminal justice system is problematic. Let’s talk about why.
The US has the highest incarceration rate in the world, with 698 people incarcerated for every 100,000 residents. That’s 1.6 times the rate of Brazil, 6 times the rate of Canada, and 15 times the rate of Japan.2
The vast differences in the rate of gun homicides are mirrored by the racial inequities of incarceration in the US. While young Black men are most likely to be victims of gun homicide, they are also most likely to be incarcerated.3
More broadly, Black Americans are most likely to be arrested for weapons possession, despite research showing that gun ownership is higher among White Americans.4

Interact with this graph by toggling the legend items or hovering on data points

Black Americans are also overwhelmingly more likely to be jailed.5

Interact with this graph by toggling the legend items or hovering on data points

And though overall incarceration rates have seen recent declines, rates remain higher for non-White Americans, and in particular for men of color.3

Interact with this graph by toggling the legend items or hovering on data points

The statistics we've just explored have historically been used to support race based theories of criminality, harmful and unsubstantiated theories that frame communities of color in the US as supporting cultures of violence.
And these theories have in turn supported law enforcement tactics that treat entire communities as responsible for high rates of violence, such as heavier policing in communities of color as well as racist programs such as Stop and Frisk.
Yet data show that the perpetrators of gun violence often constitute less than 1% of the population in major cities in the US.6
And that these individuals are often connected and caught in cycles of retaliatory violence.
In response, many cities across the US have implemented local intervention strategies that work to humanize rather than criminalize those at the center of gun violence.1,7

Hover on a location to learn more about each program or on a county to see the gun homicide rate between 2010-2018.

They have found that focusing on small networks of known individuals involved in firearm activity is more effective than heavily policing entire neighborhoods.
These local strategies work by offering tailored support and messaging that individuals at the center of gun violence are valued and that both their safety and accountability is critical to overall community well-being.
By framing these individuals as assets to the community, they promote peace and accountability without further contributing to systems of mass incarceration and racial inequity in the US.
Some work independently to de-escalate potentially lethal situations while others work in partnership with law enforcement to build community trust. Others work out of hospitals, reaching individuals after they have been injured by a firearm to end cycles of retaliation.
The common thread among these strategies is that all rely on the expertise of community members and individuals who have deep personal experiences with cyclical gun violence.
And the results provide reason for consideration. Richmond, CA, at its peak labeled as one of the most deadly cities in the US, saw gun homicides decrease by over 40% after launching its local gun violence reduction program, the Office of Neighborhood Safety, in 2007.8

Interact with this graph by toggling the legend items or hovering on data points

Non-fatal shootings also fell significantly after the program was adopted.8
These programs show that local, community-based gun violence reduction programs can contribute meaningful solutions to America’s gun crisis. As part of a larger integrated set of strategies, local gun violence intervention can lessen the impacts of gun violence on communities of color, without detracting from much needed policy level gun reform.
Recent movements including March For Our Lives and Black Lives Matter have done powerful work to bring mass shootings and police shootings to the forefront of media and policy discussions.
What will it take to elevate daily gun violence to this national discourse? And how do we reckon with a gun violence crisis that disproportionately kills and criminalizes Black and Brown youth?

Explore the resources below to learn more about this work being undertaken by cities and organizations around the country.